From LeetCode:
A city’s skyline is the outer contour of the silhouette formed by all the buildings in that city when viewed from a distance. Suppose you are given the locations and height of all the buildings in a cityscape. Write a program to output the skyline formed by these buildings.
The geometric information of each building is represented by a triplet of integers
[Li, Ri, Hi], whereLiandRiare thexcoordinates of the left and right edge of the ith building andHiis its height.The output is a list of “key points” in the format of
[[x1, y1], ...]. A key point is the left endpoint of a horizontal line segment. Note that last key point, where the rightmost building ends, is merely used to mark the termination of the skyline, and always has zero height.Also, the ground in between any two adjacent buildings should be considered part of the skyline contour.
Input: [
    [2, 9, 10], [3, 7, 15], [5, 12, 12],
    [15, 20, 10], [19, 24, 8]
]
Output: [
    [2, 10], [3, 15], [7, 12], [12, 0],
    [15, 10], [20, 8], [24, 0]
]
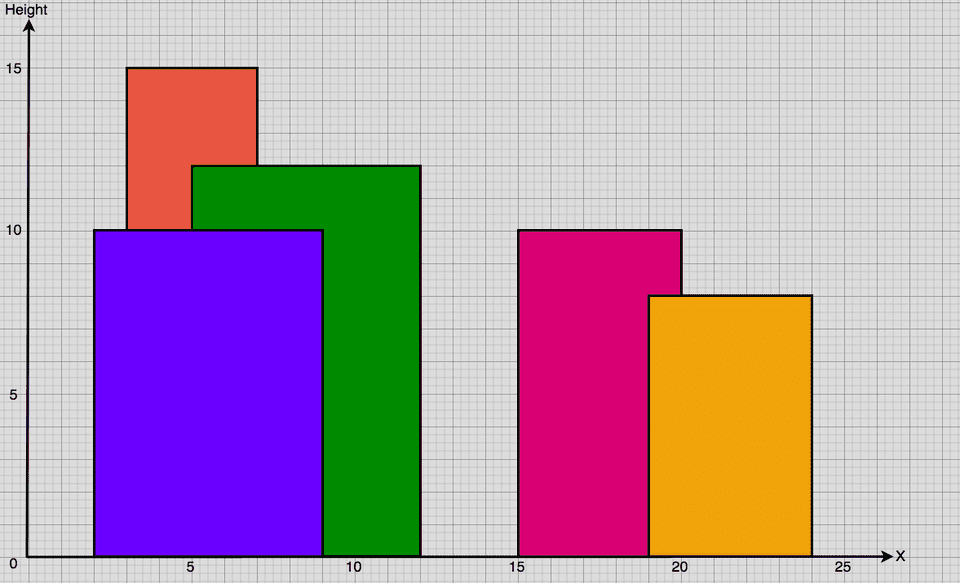
This problem warrants the use of some visuals to aid our understanding. Let’s first see what the inputs we’ve been given look like:

Our goal is to return a set of (x, y) coordinates which represent key points on the skyline. A natural approach to this problem would be to traverse through the graph and, for each x, evaluate all buildings positioned above it to see if a key point exists.
Of course, the difficulty lies in doing this efficiently. To determine if a key point can be found at x, we’ll have to account for:
- Buildings currently positioned above
x - Buildings whose widths start at
x - Buildings whose widths end at
x
Single Point Analysis

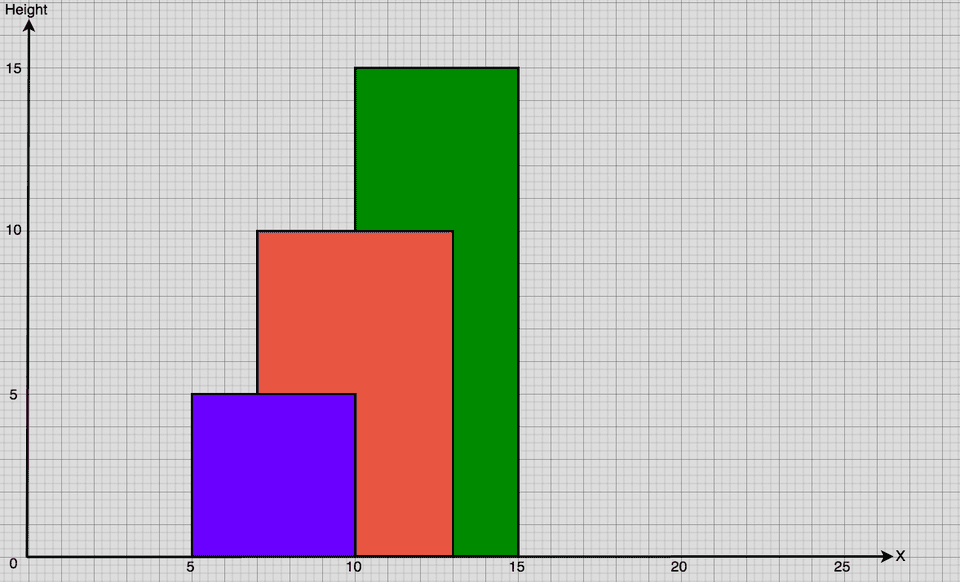
Let’s examine the above diagram and see if it’s possible for there to be a key point above x = 10:
- The leftmost building is no longer in play because its width ends at
x = 10. - The middle building covers
x, so its height (10) might give us the y-coordinate of a key point. - The width of the rightmost building starts at
x, so its height (15) might also help us establish a key point.
We can describe the middle and rightmost buildings as candidate buildings. Since the rightmost building is taller than the middle one, it’ll definitely be responsible for the portion of the skyline at x = 10. Thus, we use the height of the rightmost building to establish (10, 15) as key point.
So far, it seems that we only need to move along the x-axis and keep track of the candidate buildings at each position. For a given x-coordinate, we’ll greedily use the height of the tallest candidate to form an endpoint.
Multiple Point Analysis
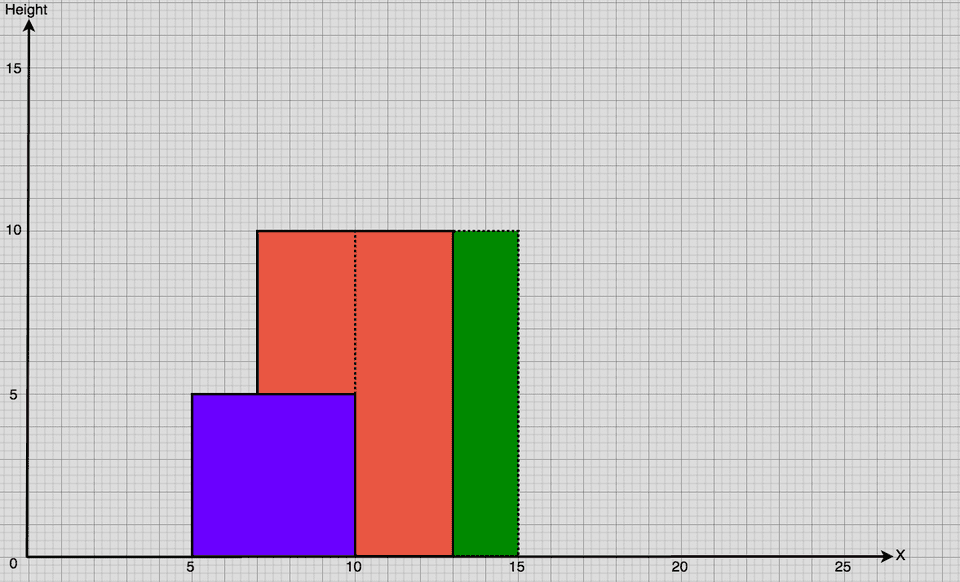
It’ll quickly become apparent to you that we can’t simply evaluate individual x-coordinates in isolation. Consider what would happen if the height of our rightmost building was reduce to that of the one in the middle:

Neither the middle building nor the right one would qualify for a new key point at x = 10. This is because a preceding key point, (7, 10), has already been established. Recall that:
A key point is the left endpoint of a horizontal line segment.
None of the buildings at x = 10 do anything to break the horizontal line segment set in place by (7, 10). Thus, (10, 10), the highest point at x = 10, cannot be considered to be a key point.
This leads us to another conclusion: A point can only be a key point if its y-coordinate differs from the preceding key point.
Selectively Scanning the X-Axis
We can attempt to inspect every x value from left to right, but this drives our time complexity to at least approximately O(nk) –– where n is the number of buildings and k is the width of the widest building.
Let’s refer back to our original input:
![A visual representation of [[2, 9, 10], [3, 7, 15], [5, 12, 12], [15, 20, 10], [19, 24, 8]] A visual representation of [[2, 9, 10], [3, 7, 15], [5, 12, 12], [15, 20, 10], [19, 24, 8]]](/static/20c4e3b21c6be6bc78983cfd620ba93d/d9199/skyline-input.png)
Take some time to glance at the above diagram. Do you observe that every key point seems to be located at the edge of a building? Not all building edges support key points, sure –– but when we do find a key point, it happens to be on a building’s edge.
For instance, the key point (3, 15) is marked by the left edge of the 2nd building, while the next key point, (7, 12), is marked by the same building’s right edge.
Instead of scanning every x value, we’ll simply consider the x values that demarcate the edges of buildings. Given n buildings, there are a total of 2n edges, so our movement along the x-axis will only take O(n) time.
From Intuition to Code
That was quite a lot to digest, so let’s briefly recap what we’ve learnt. To construct our skyline, we’ll have to:
- Determine the existence of key points at specific x-coordinates (at the edges of buildings)
- Keep track of preceding key points we’ve identified
- Keep track of the candidate buildings for each examined x-coordinate
Let’s first lock down the x-coordinates we’ll be scanning:
Building = collections.namedtuple('Building', ('l', 'r', 'h'))

# Dict that maps x-coordinates to buildings
# Indicates the side of the associated building
# { 2: { 'left': [0] }, ... }
scan = collections.defaultdict(
    lambda: collections.defaultdict(list)
)

# Array for storing buildings as namedtuples
B = []

for b_idx, b in enumerate(buildings):
    l, r, h = b

    # Store buildings as named tuples
    # for better readability
    B.append(Building(l, r, h))

    # Store x-coordinates we're scanning
    # and their associated buildings
    scan[l]['left'].append(b_idx)
    scan[r]['right'].append(b_idx)

# [(2, { 'left': [0] }), (3, { 'left': [1] }), ...]
scan = sorted(scan.items())
What we’ve done here is simply reorganise the input data we’ve been given. We’re segmenting buildings by their x-coordinates and placing them into sub-segments depending on whether their left or right side falls on a given x value.
We still don’t know all the candidate buildings for each x-coordinate. This is something we’ll determine on the fly as we traverse down the list (i.e. scan = [...]) which we’ve just built.
Active = collections.namedtuple('Active', ('val', 'b'))

# Build `scan` array
# ...

# Array to keep track of candidates
active = []

# Array to store key points
res = []

for x, data in scan:
    # Remove expired candidates
    while active and active[0].b.r <= x:
        heapq.heappop(active)

    # Add "incoming" candidates
    for b_idx in data['left']:
        heapq.heappush(
            active,
            Active(-B[b_idx].h, B[b_idx])
        )

    # Case 1:
    # Examining first x-coordinate, we simply add
    # new key point based on top candidate
    if not res:
        res.append((x, active[0].b.h))

    # Case 2:
    # No more candidates, key point at 0
    elif not active:
        res.append((x, 0))

    # Case 3:
    # Top candidate's height differs from
    # preceding key point, add new key point
    elif active[0].b.h != res[-1][1]:
        res.append((x, active[0].b.h))

return res
We use a max heap (active) to keep track of our candidate buildings. A max heap is a sensible choice since we’re primarily concerned with the tallest of the lot.
For every x-coordinate we scan, if we find that there are “incoming” buildings (i.e. their left edges fall on x), we’ll add those buildings to our heap. Similarly, we’ll pop buildings whose right edges we’ve crossed out of the heap, because these buildings are no longer relevant to our key point analysis.
Given n number of buildings, our algorithm runs in O(n) space and O(n log n) time.
With that, we’ve solved The Skyline Problem 🌆🌃🏙.
Full Solution
import collections

Building = collections.namedtuple('Building', ('l', 'r', 'h'))
Active = collections.namedtuple('Active', ('val', 'b'))

def get_skyline(buildings):
    scan = collections.defaultdict(
        lambda: collections.defaultdict(list)
    )
    B = []
    for b_idx, b in enumerate(buildings):
        l, r, h = b
        B.append(Building(l, r, h))
        scan[l]['left'].append(b_idx)
        scan[r]['right'].append(b_idx)

    active = []
    res = []
    scan = sorted(scan.items())

    for x, data in scan:
        while active and active[0].b.r <= x:
            heapq.heappop(active)

        for b_idx in data['left']:
            heapq.heappush(
                active,
                Active(-B[b_idx].h, B[b_idx])
            )

        if not res:
            res.append((x, active[0].b.h))
        elif not active:
            res.append((x, 0))
        elif active[0].b.h != res[-1][1]:
            res.append((x, active[0].b.h))

    return res